GlassFish v3 Monitoring One Pager [
Unknown macro: {TableOfContents title='GlassFish v3 Monitoring '}
|(TableOfContentstitle='GlassFishv3Monitoring')] 1. Introduction 1.1. Project/Component Working Name: Monitoring in GlassFish V3 1.2. Name(s) and e-mail address of Document Author(s)/Supplier: Prashanth Abbagani: prashanth.abbagani@sun.com Harpreet Singh: harpreet.singh@sun.com Jennifer Chou: jennifer.chou@sun.com Mahesh Kannan: mahesh.kannan@sun.com Sreenivas Munnangi: sreenivas.munnangi@sun.com 1.3. Date of This Document: 06/27/08 2. Project Summary 2.1. Project Description: Java applications which are critical to the business often suffer from performance problems. The magnitude of the problem increases when the business transactions are at its peak causing huge losses. Administrators who are trying to find the root cause of the problem spend a lot of time in trying to diagnose the problem with the tools available in the market. These tools are not viable to be used in a production environment due to the high overhead they impose, in effect mandating them to use these tools in either test or development environment. Many times, the problems are either not reproducible or it takes too long reproduce the problem. Moreover the administrators who are looking into the problem often do not have anough application knowledge and diagnosing the problem becomes all more difficult. Administrators need a lightweight tool to identify the problem, so it can be used with little overhead in the production environment. Apart from this, they need to have enough details to be able to identify the root cause of the problems in production environment without impacting the businesses. Application server would be the right product to build this intelligence of generating the lightweight data in production environment and analysing them to present it in a meaningful way, so the administrators can get to the root cause of the problem. This will also result in giving value to the users by giving the right set of tools along with App Server product. See below for a longer, more detailed technical description. 2.2. Risks and Assumptions:
- Risks: None.
- Assumptions: gfProbes Infrastructure will work on JDK 6
3. Problem Summary 3.1. Problem Area: Administrators need a lightweight production monitoring that can give enough details when the problems occur. There is a need for lightweight monitoring mechanism that will allow monitoring to be turned on in production environment with minimal impact. There should be no overhead when there is no monitoring. There is a need for an infrastructure that allows clients to decide what should be monitored with an ability to monitor specific issues (e.g: Only HTTP 200 OK response). There is also a need to allow clients to conditionally monitor some activity (e.g: Track ejb methods ONLY when called within a Tx). Additionally, there should be capability to monitor components beyond EJB, Web etc (ThreadPools, Replication etc) 3.2. Justification: The monitoring in Sun Appserver has been poor throughout the product life cycle and it did not evolve as much as the other parts of GlassFish. Today GlassFish is well known for its Enterprise features like Clustering, Load Balancing, Administration, Web Services, JBI etc., and monitoring isn't mentioned there. We want to change that and would like to add value to the product by providing a good monitoring solution for V3. GlassFish v2 monitoring infrastructure is heavy weight with three monitoring levels:
In the low mode, simple statisitics are captured (e.g: statistics like createCount for all EJBs or all apps). In the high mode, in addition to the simple statistics, method statistics are also calculated (e.g: method count, duration etc). Users can also call CallFlow to do further monitoring.
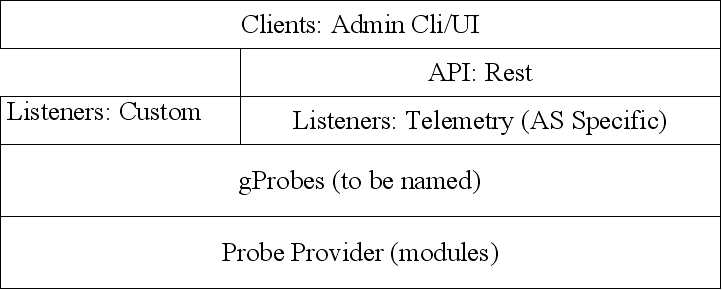
The current infrastructure is not powerful enough. The only way to find out the number of times a method is called requires the monitoring level to be at "High". However, turning on monitoring to high, turns on monitoring for all components impacting the system performance. What is required is a very lightweight monitoring that allows monitoring of only what is needed by the client. In addition when no client is interested in any monitoring data the system should operate without any overhead. Also, the set of monitorable data is fixed. There is no easy/extensible way to add new monitoring data to the system. 4. Technical Description: 4.1. Details 4.1.0 Architectural Block Diagram Cannot resolve external resource into attachment. 4.1.1 gfProbe/gProbes/Flashlight Infrastructure Now Called: Flashlight gfProbe is a lightweight and extensible framework that allows clients to monitor GlassFish in a production environment. The framework also allows new clients to be written after the product has shipped and hence is extensible. The infrastructure also ensures that the system operates with zero overhead when no monitoring is going on.
Monitoring using gfProbe framework is done by instrumenting the target code (server code). More specifically, only methods that provide monitoring data (or being monitored) are instrumented (using method retransformation support provided by JDK6). When there are no clients, then no instrumentation is done and hence the system operates with zero monitoring overhead. 4.1.1.1 Probe Provider Factory The Probe Infrastructure provides a Factory class that allows a Provider to register an interface as a Provider. The interface typically defines the methods that signals probe points.
@Contract
public interface ProbeProviderFactory {
    public <T> T getProbeProvider(String moduleName, String providerName, String appName, Class<T> providerClazz)
            throws InstantiationException, IllegalAccessException;
The ProbeProviderFactory.getProbeProvider() method allows a provider interface to be registered against a <module-name, provider-name, application-name> tuple. The method returns a class that implements this interface. The class is generated at runtime using ASM.The appName can be null. 4.1.1.2 Probe Providers As mentioned previously, a probe provider is basically an interface that provides a high level view of the probe points (or events) in the system. A v3 container or module may define a ProbeProvider to emit probe events to signal high level events. For example, the transaction manager module may define a ProbeProvider as follows:
@ProbeProvider
 public interface TxManager {
    @ProbeParams("{txId}")
    @ProbeName("begin")
    public void onTxBegin(String txId);

    @ProbeParams("{status}")
    public void onCompletion(boolean outcome);
 }
The transaction manager then registers this class with the Probe Infrastructure by calling the ProbeProviderFactory.getProvider() method. The return value from this method will be a class that implements the TxManager interface. Underlying implementation of TxManager is generated by ASM. By default a no-op implmentation of the methods is created. In case there are no Listeners, the methods do not incur any costs. 4.1.1.3 ProbeName The @ProbeName annotaion defines the name of the probe. If not used, the name of the method will be used as the probe name. Note: that if the provider class has overloaded methods, then this annotation should be used to define a non-conflicting name. 4.1.1.4 ProbeParams The @ProbeParams annotation in the Provider class is used to give a name to each of the values that are passed as arguments. This allows the client to choose a subset of values in their methods. See the next couple of sections for more details. Note: Instead of using @ProbeParams, we could have used @ProbeParam annotation in ProbeProviderFactory to annotate individual probe parameters. 4.1.1.5 Emitting probe events Once registered, the Provider is now ready to emit events that clients can listen to. Thus, deep in the module implementation, when the module knows that it is about to begin a transaction, it can emit the event by calling the onTxBegin method. The code snippet below lists the code for registering the provider and the code for emitting the event.
public class TransactionManagerImpl {
     TxManager txProvider = ProbeProviderFactory.
          createProvider("tx", "TxManager", null,
               TxManager.class);

     public void begin() {
        String txId = createTransactionId();
        ....
        txProvider.onTxBegin(txId); //emit
      }
  }
4.1.1.7 ProbeProviderInfo ProbeProviderInfo contains details about individual probe point in a probe provider class.
public interface ProbeProviderInfo {

      public String getModuleName();

      public String getProviderName();

      public String getApplicationName();

      public String getProbeName();

      public String[] getParamterNames();

      public Class getParamterTypes();

 }
4.1.1.8 Probe Listeners for listening to ProbeProvider events by ProbeProviders Listeners (or clients) express interests in probe points (or probe events) by a particular set of Probe Providers. The client just needs to annotate the methods with @ProbeListener passing just the <module-name>:<provider-name>:<app-name>:<probe-name> to receive callback when the probe "fires". Here is an example of a client that listens to the onTxBegin() of our TxManager indicates the type of events that it is interested in.
public class TxListener {
    AtomicInteger txCount = ....;

    @ProbeListner("tx:TxManager::begin")
    public void begin(String txId) {
      txCount++;
    }
  }
4.1.1.9 Probe Listeners for listening to ProbeProvider events by Non-Provider Classes gfProbes infrastructure allows clients to monitor glassfish even in the absence of provider classes. This is done by allowing clients to receive callbacks when a java methods are entered / exited. Note that while this approach allows a client to monitor legacy code, it may not always be possible to receive "high-level" events. For example, while it is easy to monitor (through gfProbes) when TransactionManagerImpl.begin() entered / exited, the client cannot determine the transaction ID in this case.
public class TxMonitor {
     @MethodEntry("tx:com.sun.tx.TxMgrImpl::onTxBegin")
     public void onTx(String tId) {
       count++;
     }
  }
4.1.1.10 Annotations for monitoring method entry, exit and exceptions 4.1.1.10.1 Annotations for monitoring method entry The @MethodEntry annotation must be used by the client to receive callback when the target method is entered. The client method argument types and count must match the target methods parameter types/count. (This restriction might be removed later) 4.1.1.10.2 Annotations for monitoring method exit The @MethodExit annotation must be used by the client to receive callback when the target method is exited. The client method argument types and count must match the target methods parameter types/count. (This restriction might be removed later). The first parameter in the client method should match the return type of the target method (only if the target method has a non void return type) 4.1.1.10.3. Annotations for monitoring exceptions The @OnException annotation must be used by the client to receive callback when the target method exits because of an exception. The client method argument types and count must match the target methods parameter types/count. (This restriction might be removed later). The first parameter in the client method should be of type Throwable 4.1.1.11 Computed Params: Probe clients can express their interest in certain predefined values that are not part of the target method definition. For example, {{$
Unknown macro: {gf.appname}
, $
Unknown macro: {gf.modulename}
}} etc. are some of the computed params that are available to the clients, these values are computed/evaluated only on demand and provided by the probe infrastructure. 4.1.1.12 Registering Listeners A client is registered with the gfProbe framework to receive callbacks. This is done by calling ProbeClientMediator.registerListener() method.
@Contract
public interface ProbeClientMediator {

    public Collection<ProbeClientMethodHandle> registerListener(Object listener);

}
4.1.1.13 Note about gfProbe Listeners The listener can be any java object, can extend any object and can implement any number of interfaces. The only restriction is that the return value from callback methods must be void. The listener must be thread safe as the target method that is being probed may be entered by multiple threads. However, the framework will provide utility classes to perform some common operations like count(), avg(), sum() etc. A listener that is not registered to listen for events will never be called by the framework. Thus unregistered listeners invoke no overhead. 4.1.1.15 A Note About Btrace Btrace provides a similar feature like gfProbes but there are many differences in the design and implementation choices taken by these two frameworks. While gfProbe client methods are really callback methods, Btrace methods are used mainly used to extract the byte code and inject it directly into the target class. This means that there is no client here. Also, the set of operations that a Btrace client can perform is also limited. gfProbe clients on the other hand are true clients and infact are called in the same thread as the target/probed method. This allows the client to use thread locals and even access thread locals of the probed system (if allowed). However, a gfProbe client will have the same set of restrictions as a JavaEE application (like they cannot open server socket, create new thread etc.) Btrace has many features that allows debugging of a target applications. For example, it is easy to track the number of times a java object is locked / unlocked. gfProbe does not provide these facilities. 4.1.2. Monitoring Infrastructure The architectural block diagram gives a high level design on how the monitoring in V3 prelude will be implemented. Telemetry is the core of Monitoring layer which is responsible for listening, collecting and analyzing the data that is generated through the gfProbes infrastructure. Each of these will be further discussed in detail. 4.1.2.1 Probe Providers (Web Container) For GlassFish v3 Prelude release the Monitoring infrastructure will depend on the Probe Provider implementation by the Web Container. The Web Container will need to provide certain probe points as listed by gfProbes Probe Provider contract 4.1.2.2 Probe Listeners(Web Container) The Monitoring infrastructure will write ProbeListeners to the probe points listed by the web container Probe Provider. These ProbeListeners are called as Telemetry Objects in the context of Monitoring Infrastructure and are discussed in details in the following sub-sections. 4.1.2.3 Telemetry (Built-in ProbeListeners)(Web Container) 4.1.2.3.1 Probe Listener Telemetry component is responsible for collecting the monitoring information at the lowest level. The data collection can happen in two ways:
- By listening to the data through registering the listeners for Probe points in the provider module.
- By pulling the information on need basis (sampling) from certain components of App Server which doesn't provide the data through Probe infrastructure (ex. JVM information like CPU utilization). This component will collect the data which is specific to the Application Server monitoring.
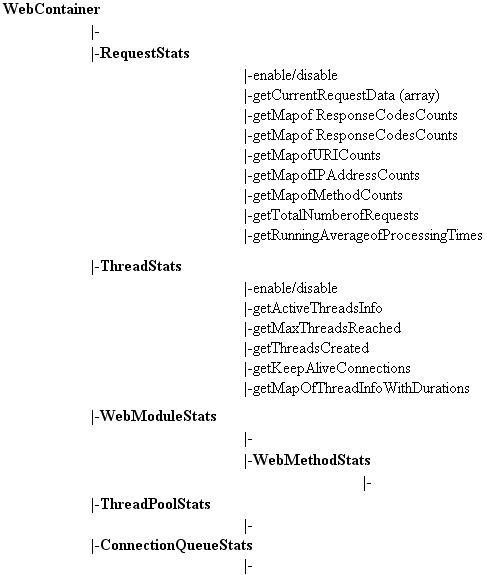
The Telemetry component listeners for a provider will be registered or unregistered based on the lifecycle event from the provider (when provider is coming up or going down), thus making the Telemetry component agnostic to whichever modules its associated with (i.e no dependencies). Once the listeners are registered, the data is collected from probe points, where each record can encompass of several events from several listeners (ex., getting the response time data from 'Request start' and 'Request end' probes/listeners). Analyzer is a built-in facility of the Telemetry module which will massage the data collected from listeners to expose it using Object View Hierarchy. 4.1.2.3.2 Configuration The user will be allowed to configure to turn the monitoring to 'ON' or 'OFF' which will in turn register/unregister the listeners at the Telemetry level for certain monitorable components and its attributes. The configuration changes can be done from either GUI or CLI commands. The interface provided from GUI will be basic for this release (turn it at a very high level, say for each provider component or a sub component, ex. turn off the Request statistic gathering), and can be more advanced (say, at the monitorable attribute level or turn off based on a feature) for next release. The CLI will expose the 'asadmin set' command to allow the configuration (enable/disable) of monitorable components. The CLI will expose the 'asadmin set' command to allow the configuration (enable/disable) of monitorable components. This will be in addition to what we would do in V2 (see below). The existing domain.xml elements and the child nodes will be preserved to turn the monitoring levels at the very high level for a module (for ex. turn off the monitoring for all the components of web-container). The levels 'Low' and 'High' will have no difference for V3 release, we will expose them from UI as either turning them 'On' or 'Off'. The monitoring at the more granular level will not be done for Prelude, and we will be supporting only the at a very high level for Prelude. 4.1.2.3.3 Monitoring Object View Hierarchy interface(OVH) Object View Hierarchy (OVH) is the interface with which the monitoring infrastructure exposes its information for the clients. Consider this as a tree where the root is located by the clients using the HK2 habitat. It consists of interfaces for the Telemetry objects to register/unregister themselves as the tree nodes. Once part of the tree they are exposed to any client (REST/CLI). The tree nodes are dynamically changing either when a new module comes in, or when the configuration is changed (monitoring for a node/attribute turned on/off). The requests for monitoring data coming in to the Object View Hierarchy are served by retrieving the data from the Telemetry objects (which consists of the latest and greatest information). Thus the information gathering happens at a much granular level only for the requested nodes (or attributes for next release). For example the Request Information gathering which can be a very expensive operation during the peak time of a business, one can choose to turn it off and this object will be omitted from the hierarchy and also the probe listeners are unregistered to stop collecting the information. The CLI will traverse the OVH for a given dotted name, which results in the retrieval of the data corresponding to the dotted name. We will be backward compatible with regards to the dotted name. Following figure gives the detailed view of the Monitoring Object View Hierarchy for the Web container, which will be the only provider for this release.
Cannot resolve external resource into attachment. 4.1.2.4.2 CLI commands to display (reference to next section) The custom scripts that are deployed will be given the ability to expose its monitoring data using the Object view hierarchy, means that the custom script writer will have to attach himself as the node in the object view hierarchy. This will enable the CLI commands dotted name and the REST to expose his monitorable data to the end user. The following section gives details on the CLI commands. 4.1.2.5 CLI commands to configure and display Following are the list of asadmin commands that will be provided as part of monitoring infrastructure
- asadmin monitor command: Exposes data from the Monitorable attributes. The output of the monitor command models Unix's vmstat.
The syntax of the monitor command is as follows: monitor --type monitor_type --interval 30 --filter filter --filename filename target To monitor http-listener1 in server instance:
>asadmin monitor --type web-container.http-listener.http-listener1 --interval=5 server
Where type denotes the dotted name value referring to the sub component which you would like to monitor (http-listener1 in this case). Note that the dotted name would be able to identify any third party component also, provided they are implemented with the right contracts (annotations) and interfaces. The filename option allows user to save the monitoring attributes to a file in comma separated format. The interval option is the duration of time when it refreshes the screen with new data from the server. We will also support the keywords like httplistener, jvm etc., for --type option, to be backward compatible with V2.
- asadmin get --monitor command: This command will expose the monitorable attributes in the dotted name format. Following is the syntax
asadmin get --monitor dotted-name
- set: This command will enable/disable the monitoring of Monitorable attributes. This will in turn call the interface enable/disable which is exposed as part of the Object view hierarchy tree at different nodes. The syntax is as follows
set <dotted-name=true|false> [target=server]
{{ex: asadmin set server.web-container.thread-pool.thread-pool-1.enabled=false
Note that the dotted name exposed should be able to accommodate any third party components also. 4.1.2.6 Framework Utilities There will be certain utility classes that will be provided (as part of admin/monitor module) to assist Telemetry Objects and custom scripts to make collection and analysis of data easier. These classes are listed below:
- @Monitorable Interface: This marker interface designates attributes and methods as monitorable
- Statistics Utility
- Counter: Provides a counter that a class can use to maintain count.
- TimeStatistic: Provide timing information to clients
- Average: Provide average.
The framework will also provide a tree data structure that will be created by clients to store data. This tree will be queried by runtime to provide data. The tree will be in the form of the object view hierarchy. Consider a WebTelemetryClient, it wants to count the number of times methodEntry was called. It declares a method called "getCount" and makes it monitorable. It uses the Counter utility class to maintain the count.
public class WebTelemetryClient{

    Counter counter;

    @Monitorable ("count")
    public long getCount (){
      return counter.getCount ();
    }

    @ProbeListener (web::methodEntry)
    public methodEntered (){
      counter.increment ();
    }

    public void init (){

        TreeNode node = TreeNodeFactory.createTreeNode ("webTelemetry", this);
        TreeNode child = TreeNodeFactory.createTreeNode ("count", this);
        node.addChild ("count");
    }
}
The WebTelemetryObject registers itself as a TreeNode and registers the "getCount" monitorable method to the tree node. At runtime admin cli will get an instance of the TreeNode class ("webTelemetry object) from the habitat and invoke getCount (treeNode.getNode ("count).getValue () on it to return the value of getCount. 4.1.2.7 GUI A few basic monitoring UI pages that are most relevant to the web tier will be shown in the Admin Console. Please refer to Section 4.1 of the Admin GUI Functional Spec for more details. 4.1.2.9 Pluggability Pluggability in general is described in a separate spec. Here we will discuss the pluggability aspects which are specific to monitoring. Any module (either third party or built-in) will be able to use our monitoring infrastructure to expose the monitoring functionality for its component. A module owner would need to come up with Telemetry objects(listeners), Monitoring Object view hierarchy, Probe Points, CLI and optionally GUI interface for their module. We will provide a way (himself to the Object view hierarchy) for the module writer to be able to seamlessly integrate his module with ours to expose the monitoring capabilities for his module.
- Probe Points - Please refer to Probes section on how to do this
- Telemetry - User needs to come up with his set of listeners to listen to the exposed probes either by his module or from other modules. The probes infrastructure will give an exposed interface to build this.
- Monitoring Object view hierarchy - This is an important interface that a module owner needs to expose for him to be able to integrate with our REST/CLI interfaces. The user has to use the Object view hierarchy API to add his monitorable node the OVH for the Monitoring infrastructure to recognize them being part of the larger Object view hierarchy. They will also need to annotate each exposed attribute(variable) by @MonitoringData(#name).
- CLI - 'asadmin monitor' command will take a --type option. The --type option accepts any component exposed in the OVH, thus exposing all the monitoring attributes within with this generic command. Also exposed is the 'asadmin get --monitor <dotted-name>' command, to expose the data from Object view hierarchy in a generic way. Same is true for 'set' and 'list' commands. A third party module owner, thus will be able to integrate the monitoring functionality of his module with the existing CLI commands.
- REST - The nodes and its attributes in the OVH are exposed by URL's mapped directly to the OVH. See more details in the REST one pager.
- GUI - Please refer to the Pluggability one pager for details on how to integrate the third party GUI pages into the Appserver Admin Console. User should be able to use the Object view hierarchy and REST interfaces to write their own full blown UI functionality into the GUI pages and integrate them as part of Admin Console.
4.2. Bug/RFE Number(s): None. 4.3. In Scope: The Probe Providers that express intent to provide probe points can provide higher level artifacts that are container specific to clients. This can provide richer data for clients to monitor. This is not provided through existing solutions like profilers or debuggers. Monitoring Support for Web Container Monitoring support is only provided for WebContainer (and at a level that was supported by v2) 4.4. Out of Scope: This infrastructure cannot be used a debugger or profiler. For example, the gfProbe framework does not allow clients to receive callback when a field is updated, or when a java monitor is acquired / released. 4.4.1 Artifacts that will be delivered Post Prelude 4.1.1.6 ProviderRegistry Registered ProbeProviders can be discovered by using the provided by the ProbeProviderRegistry interface. Custom Probelisteners (section 4.1.2.4) A system administrator, developer, deployer will have the option to write their custom ProbeListeners. These ProbeListeners are defined by the contracts Provider Probe Points. A system administrator will write a custom Probe Client that listens to the probe points. The system administrator will deploy this custom script to the Probes Infrastructure and start listening to Probe Events. The scripts will be deployed through asadmin deploy command. The custom scripts will need to be packaged as a jar to be deployed onto the gfProbes infrastructure. Once deployed, the scripts can start listening to events, as well as make use of utility classes provided by the infrastructure to maintain structures like count, averages etc. 4.1.1.14 ProbeContainer Eventually, we will allow ProbeListeners to be packaged in a .jar and deployed using asadmin deploy command. The probe module will have (similar to ejb and web) its own deployer and container to host the probe listeners. Probe listeners are identified using the @ProbeListener annotation. All probe clients in a .jar/.ear file are hosted in a classloader that has visibility to all the V3 modules that are referred from the clients. Deployment of Custom ProbeListeners(4.1.2.4.1 ) Ability to deploy custom ProbeListeners through asadmin deploy command. DTrace Integration (4.1.1.16) Post Prelude
JDK 7 provides support for defining tracepoints in java applications. This allows a Dtrace script to be used to monitor the system. The basic idea is similar to defining a ProbeProvider in gfProbe framework. Here is how a Dtrace provider in JDK 7.
public interface WebContainerProvider {

    public void requestArrived();

    public void responseSent();

}
then an instance of provider is created by doing the following:
import com.sun.tracing.*;

....
ProviderFactory factory = ProviderFactory.getDefaultFactory();

WebContianerProvider webProvider = factory.createProvider(WebContainerProvider.class);

....
webProvider.requestArrived();
....
webProvider.responseSent();
To enable easy integration with the above feature, all we have to do is the following:
- When a ProbeProvider is registered with gfProbe's ProbeProviderFactory, the framework will register the provider interface with Dtrace provider as well.
- The generated code for our provider (after notifying gfProbe listeners) will simply delegate the call to the Dtrace provider (returned from step 1 above).
Framework Utilities (4.1.2.6)
-
- AgeByInterval: Provide statistics like Count per Interval, Average per interval. This class will be provided post prelude.
Monitoring Components that are out of scope
- CallFlow: Post Prelude
- Monitoring other components (like JVM, JPA, JDBC support) is post-prelude.
4.5. Interfaces: 4.5.1 Exported Interfaces Exposed @Service interfaces for the third-party monitoring, which would be included as part of Object view hierarchy, which would in turn be exposed as part of dotted names to the CLI commands. Other exported interfaces are dotted-names and all the CLI commands 4.5.1.2 gfProbes Infrastructure Exported Interfaces For all of these interfaces:
- Stability: Evolving
- Former stability: NA
package org.glassfish.gfprobe.provider;
@Contract
public interface ProbeProviderFactory {
     public <T> T getProvider(String moduleName, String providerName, String appName, Class<T> provideClazz);
  }
package org.glassfish.gfprobe.provider;
    @Retention(RetentionPolicy.RUNTIME)
    @Target(ElementType.METHOD)

   public @interface ProbeListener {
        public String value() default "";
}
package org.glassfish.gfprobe.client;
@Service
public class ProbeClientMediator {

    public void registerClient(Object obj);

}
package org.glassfish.gfprobe.client;
    @Retention(RetentionPolicy.RUNTIME)
    @Target(ElementType.METHOD)
    public @interface ProbeMethodExit {
        public String value() default "";
}
package org.glassfish.gfprobe.client;
    @Retention(RetentionPolicy.RUNTIME)
    @Target(ElementType.METHOD)

    public @interface ProbeMethodException {
       public String value() default "";
       public Class[] exceptions() default null;
    }
4.5.1.3 Utility Framework Classes
For all of these interfaces:
- Stability: Evolving
- Former stability: NA
package org.glassfish.flashlight;
import java.lang.annotation.ElementType;
import java.lang.annotation.Retention;
import java.lang.annotation.RetentionPolicy;
import java.lang.annotation.Target;

/**
 * To designate a class as monitorable so that it is published in the
 * MonitoringRegistry
 * @author Harpreet Singh
 */
@Target ({ElementType.TYPE,
          ElementType.FIELD,
          ElementType.METHOD})
@Retention (RetentionPolicy.RUNTIME)

public @interface Monitorable {
    String value () default "";
}
/**
 * @author Harpreet Singh
 */
@Contract
public interface MonitoringRuntimeDataRegistry {

    public void add (String name, TreeNode node);
    public void remove (String name);

    /**
     * @param name of the top node in the registry
     * @return TreeNode
     */
    public TreeNode get (String name);

}
package org.glassfish.flashlight.datatree;


@Contract
public interface TreeNode {


    public String getName ();
    public void setName (String name);
    // TBD getValue should take varargs
    public Object getValue ();
    public void setValue (Object value);

    public String getCategory ();
    public void setCategory (String category);

    public boolean isEnabled ();
    public void setEnabled (boolean enabled);

    // Children utility methods
    public TreeNode addChild (TreeNode newChild);

    public void setParent (TreeNode parent);
    public TreeNode getParent ();

    /**
     *
     * @return the complete dotted name to this node
     */
    public String getCompletePathName ();

    public boolean hasChildNodes ();

    /**
     * Returns a mutable view of the children
     * @return Collection<TreeNode>
     */
    public Collection<TreeNode> getChildNodes ();

    public TreeNode getNode (String completeName);

    public List<TreeNode> traverse ();


    public List<TreeNode> getNodes (String regex);

}
4.5.2 Imported interfaces ASM 3.1 is used for byte code manipulation. 4.5.3 Other interfaces (Optional) None. 4.6. Doc Impact: New CLI commands and GUI screens need to be documented. Also need to describe how the customer can implement monitoring in his (3rd party) module using our monitoring infrastructure.
Documentation will need to write manuals that describe the probe provider interfaces and must include:
- when each of the individual probe methods are invoked
- the parameter name for each parameter that are available to the client
- the set of computed parameters that are available
In addition, documentation will have to provide some sample scripts that enables monitoring of most commonly monitored data. For example, a web container may provide scripts to monitor the number of web requests, the average response times of such requests etc. 4.7. Admin/Config Impact: There will be configuration information for the monitoring elements that needs to be persisted in the domain.xml. The CLI and GUI clients are written by monitoring team for such configuration. 4.8. HA Impact: None 4.9. I18N/L10N Impact: No Impact 4.10. Packaging & Delivery:
- Monitoring infrastructure utilites will go as part of admin/monitor package.
- gfProbes Infrastructure will be a separate module. It is checked in as Flashlight module in the workspace.
4.11. Security Impact: Clients run in the same VM and have access to container artifacts. Clients however will not be able to alter the runtime state of the container. Clients will be deployed on the Probes container and they will be subject to the same restrictions as other JavaEE applications. 4.12. Compatibility Impact We think the compatibility wont be an issue with JMX/AMX and Dotted names for the final release of V3. JSR77 could be an issue as we are trying to incorporate the REST functionality. REST has some limitations in terms of the objects exposed which needs to have specific interfaces implemented in each of those objects. We need to think of a way to overcome this for the final release. JMX we think could expose the OVH using the MBean Server Interceptors and Virtual MBeans implementation. See link1, link2 for more details. When we solve the JMX problem, AMX shouldn't be an issue. Dotted names should be able to support and enhance the monitoring and configuration data from the previous release. Backward compatibility with CallFlow will be supported post-prelude. Monitoring Infrastructure will be delivered as part of the 'Prelude' release. For this release we will be concentrating on 'Web Container' monitoring only.
Probes Infrastructure will be delivered as part of the "Prelude" release. The aim is to get the web container module to provide probe points for "Prelude" For details on the Monitoring schedule - refer monitoring specification.
|
